In the ever-changing landscape of digital connectivity, your network is far from static; it is a living, breathing entity. Each day brings new developments, as your network undergoes transformations in terms of size, services utilized, communication protocols, the myriad of clients tapping into those services, and the servers dutifully delivering them. But amidst this constant evolution, another dynamic force is at play – the emergence of new threats and attacks that lurk in the shadows, poised to disrupt your network's harmony.
It's imperative to ensure that your DDoS (Distributed Denial of Service) protection system not only keeps pace with these changes but also provides you with crucial insights to shield your network from harm, while safeguarding the innocent users and clients who rely on your services.
To tackle this multifaceted challenge effectively, you need one key element: visibility into your network.
In this blog, we will delve into several key examples of network visibility, demonstrated with Radware's new "Cyber Controller" Management console.
Query 1: Have you ever wondered which protected networks (policies) in your network are responsible for generating the highest peak traffic? This can be a critical piece of information for network administrators striving to optimize performance and security. Your busiest protected networks are in many cases the ones which are more sensitive and require special attention.
Finding the top contributors to peak traffic in your protected network, can be easily achieve by navigating to the dashboard that include the "Traffic Bandwidth" widget that presents the top-5 protected networks, their peak point time and the traffic along the request time period as presented below:
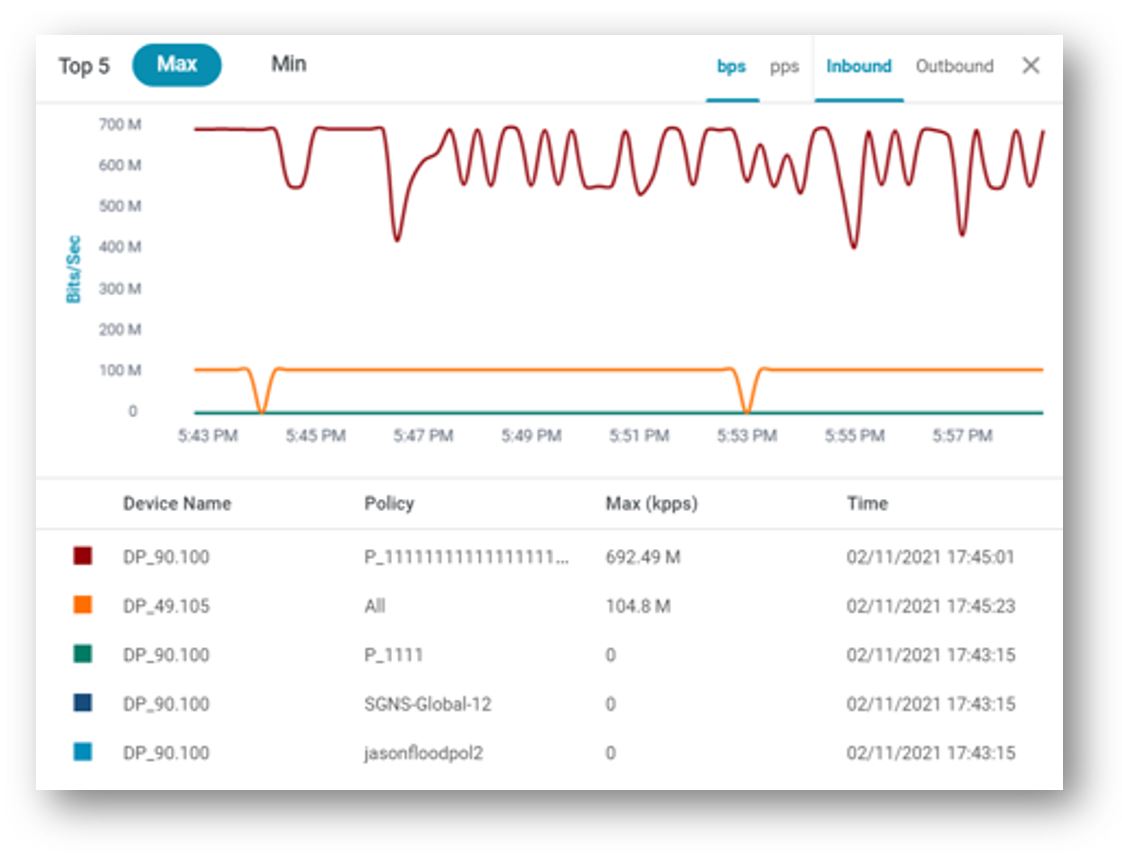
In the example above it is visible that policy named “P_1111” has the highest peak traffic at 17:45 and the max value is 692.49Mb. Now, using the widget options you can toggle between bps & pps for further analysis or change the time period to be analyzed.
Query 2: Are you aware of the dominant attack categories that have surfaced within your network over the past week? Furthermore, have you identified the protected networks where these attack categories are most frequently observed?
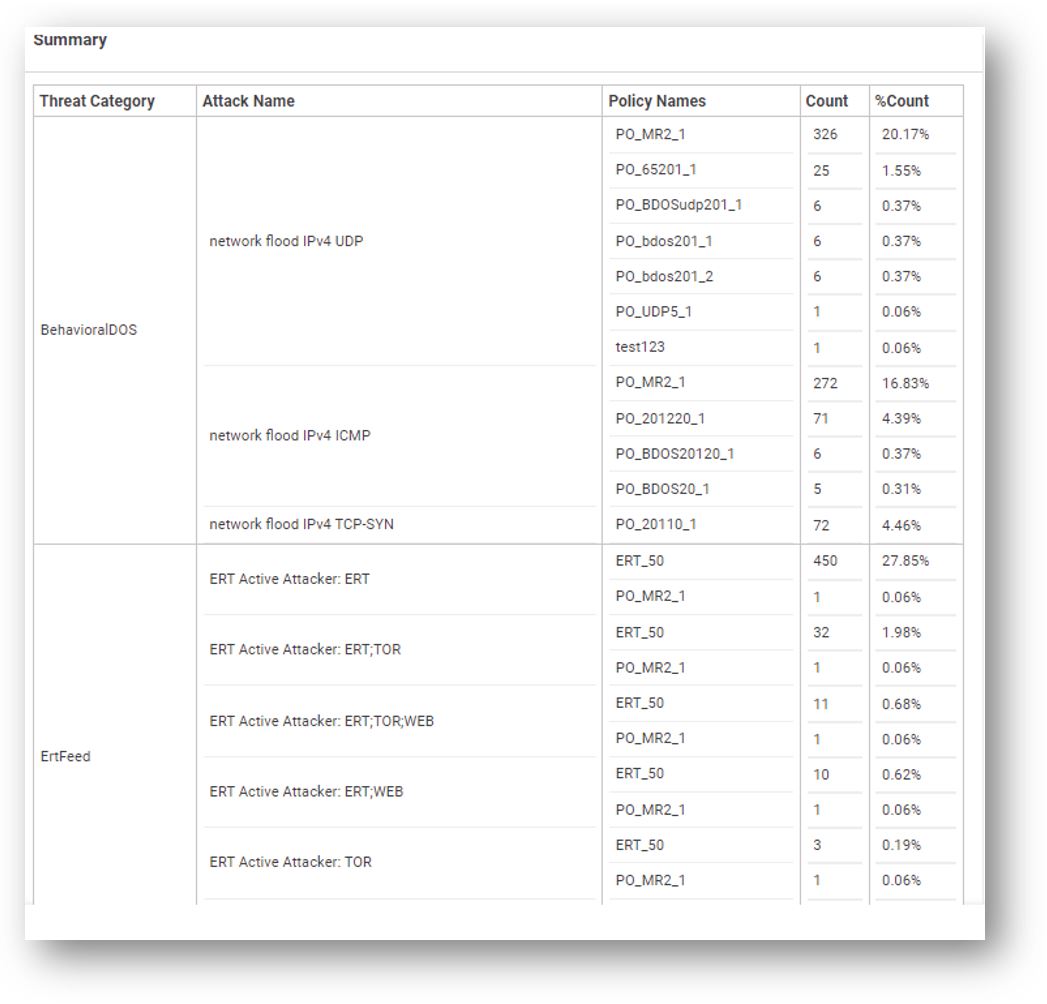
The widget below, along with its corresponding extension in the report, can furnish you with responses to the above question, occasionally revealing new trends that may have previously escaped your notice.

Further breakdown analysis is provided by same widget in a report with three levels of breakdown for further visibility and analysis per the various protected networks:
Query 3: Lately, I've been getting the sense that there's been a notable uptick in the frequency of attacks, and I'm eager to validate it.
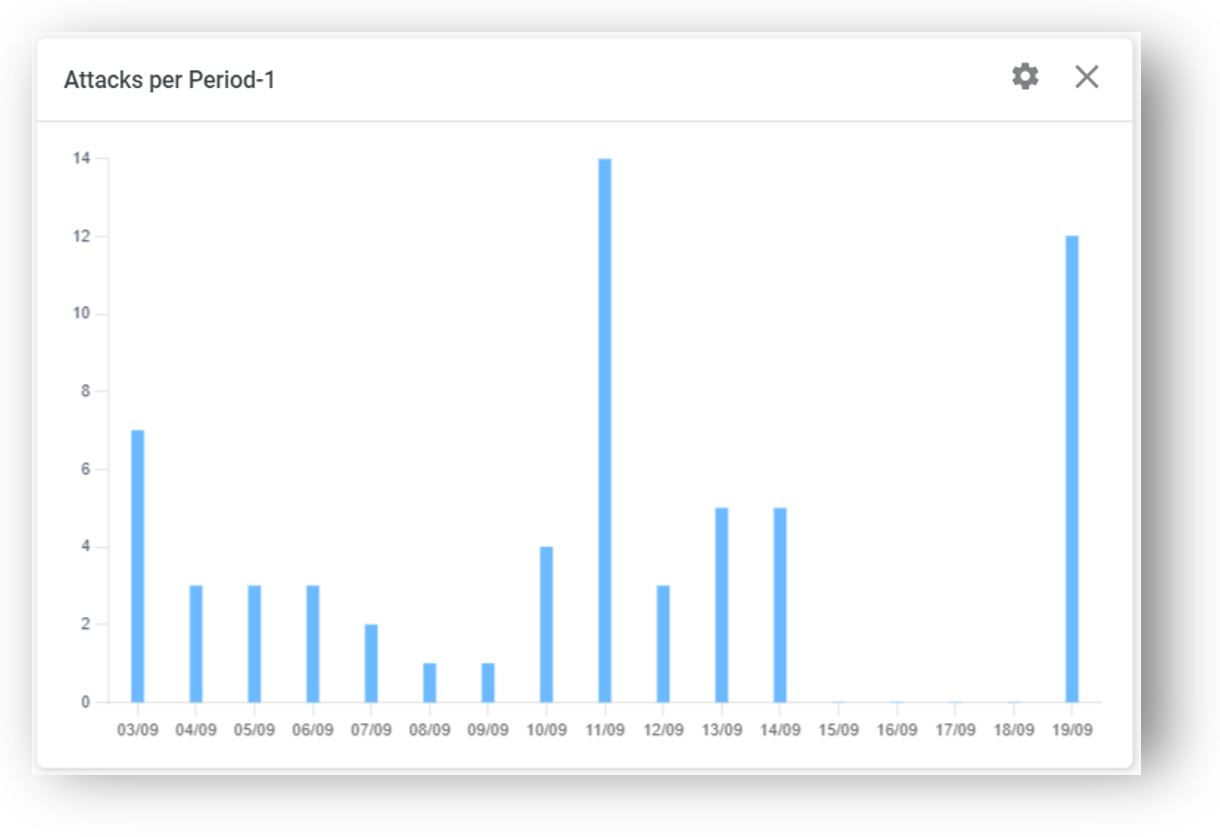
The widget above empowers users to examine and pinpoint fluctuations and spikes in attack numbers over time.
For instance, a notable increase in attacks was observed on September 11th. To delve deeper into this, you can zoom in and narrow the timeframe to that specific day, providing a clearer view. Furthermore, the widget referenced in the previously in query-2 (attack by Category) can be applied specifically to the September 11th period, allowing you to identify which attack categories experienced an uptick on that particular day.
By conducting this analysis, you can ascertain the necessary adjustments needed to refine the DDoS management protection configuration.
Query 4: I wish to analyze attacks of the same category and analyze the similarities and differences between these attacks. This can be helpful to determine if the attacks are coming from identical actors and assist in classifying the campaign and improve protection.
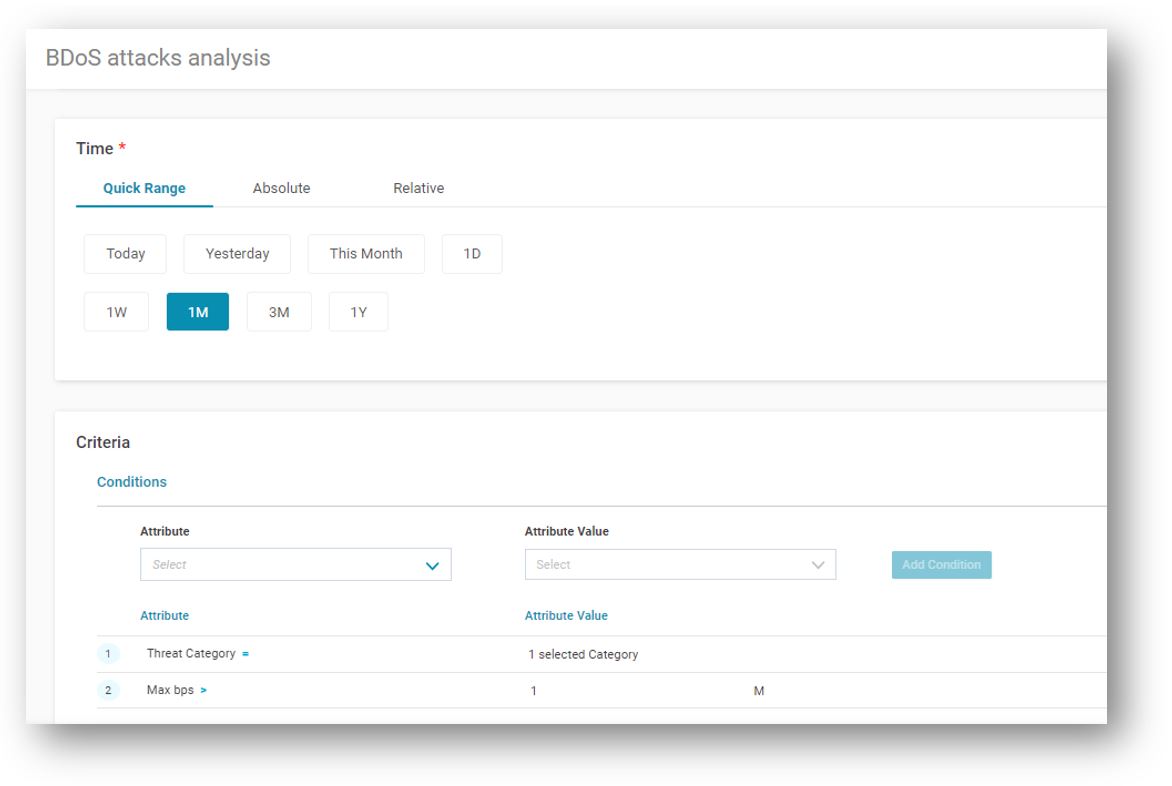
For analyzing this query, I need to have the specific attack details and not statistics. So, for this analysis, I will use a different tool “Forensics.” Forensics modules can extract to a CSV file different levels of attack information and then be further analyzed in excel.
In the example below, I wanted to analyze attacks from the last-month and refine my query so attack category “behavioral DOS” and only attacks greater than 1Mbps. Execution of this query will result in CSV file with all the attacks.
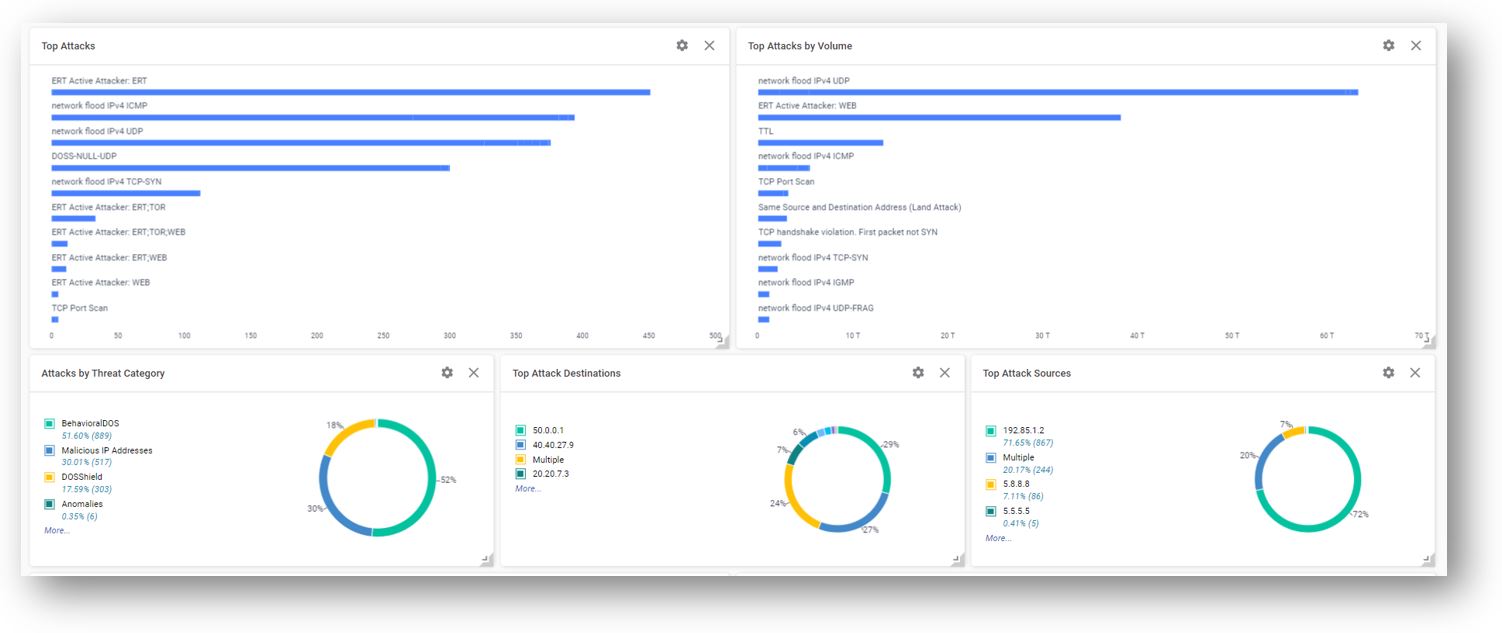
Query 5: Every now and then, I enjoy revisiting the behavior of my network to gain insights into the attacks that occur and how they are being handled by my DDoS protection system. I don't have any particular concerns in mind; instead, I'm seeking a thorough analysis from diverse viewpoints, hoping it might assist me in recognizing any emerging trends.
To achieve the above, I can open the analytics main dashboard, that provides me with about 20 widgets, each one providing me with a different point of view.
For instance, in the screenshot provided below, I can observe five distinct perspectives examining my network. This multifaceted view could potentially offer valuable insights, detect trends, or even indicate an uptick in a particular type of cyberattack volume.
If the five graphs shown above haven't yielded any insights, I can simply scroll down and examine an additional 10 graphs that offer further perspectives.
Summary
In the preceding inquiries, we explored a range of everyday situations where analytics tools can enhance your understanding and awareness of your network. Armed with this newfound visibility, you can make more informed adjustments to your DDoS Protection System, thereby bolstering the security of your network. For additional information on Radware’s Cyber Controller and management capabilities visit Radware.com